Every tool from question to decision
Datachat does far more than write SQL. It’s a complete, AI-driven analytics workflow — from asking a question to a shared, projected dashboard.
Asking and understanding
Natural-language querying
Ask in English or Hungarian. The AI selects the relevant tables, writes and runs the SQL, and configures a chart. Relative date expressions — "this year", "last month", "past 30 days" — are resolved automatically against today’s date.
Refine in chat
After the answer, keep refining: “narrow to Budapest”, “add year-over-year change”, “this year instead of last”.
Voice input
Speak your question — native browser speech recognition (free) or OpenAI Whisper for higher quality. Editable before sending.
Attach an image
Paste an Octopus8 screenshot or error message. The AI reads the field names, error codes and filter values and uses them in the query.
Advisor mode
Not sure what to ask? Describe the problem and the AI suggests relevant, ready-to-submit questions with explanations.
Automatic SQL repair
A failing query is fixed by the AI on its own (up to 3 attempts) — completely transparent to the user.
Python-based statistics
In deep analysis the AI also runs Python: regression, correlation, trend fitting, forecasting, basket analysis — things plain SQL can’t do.
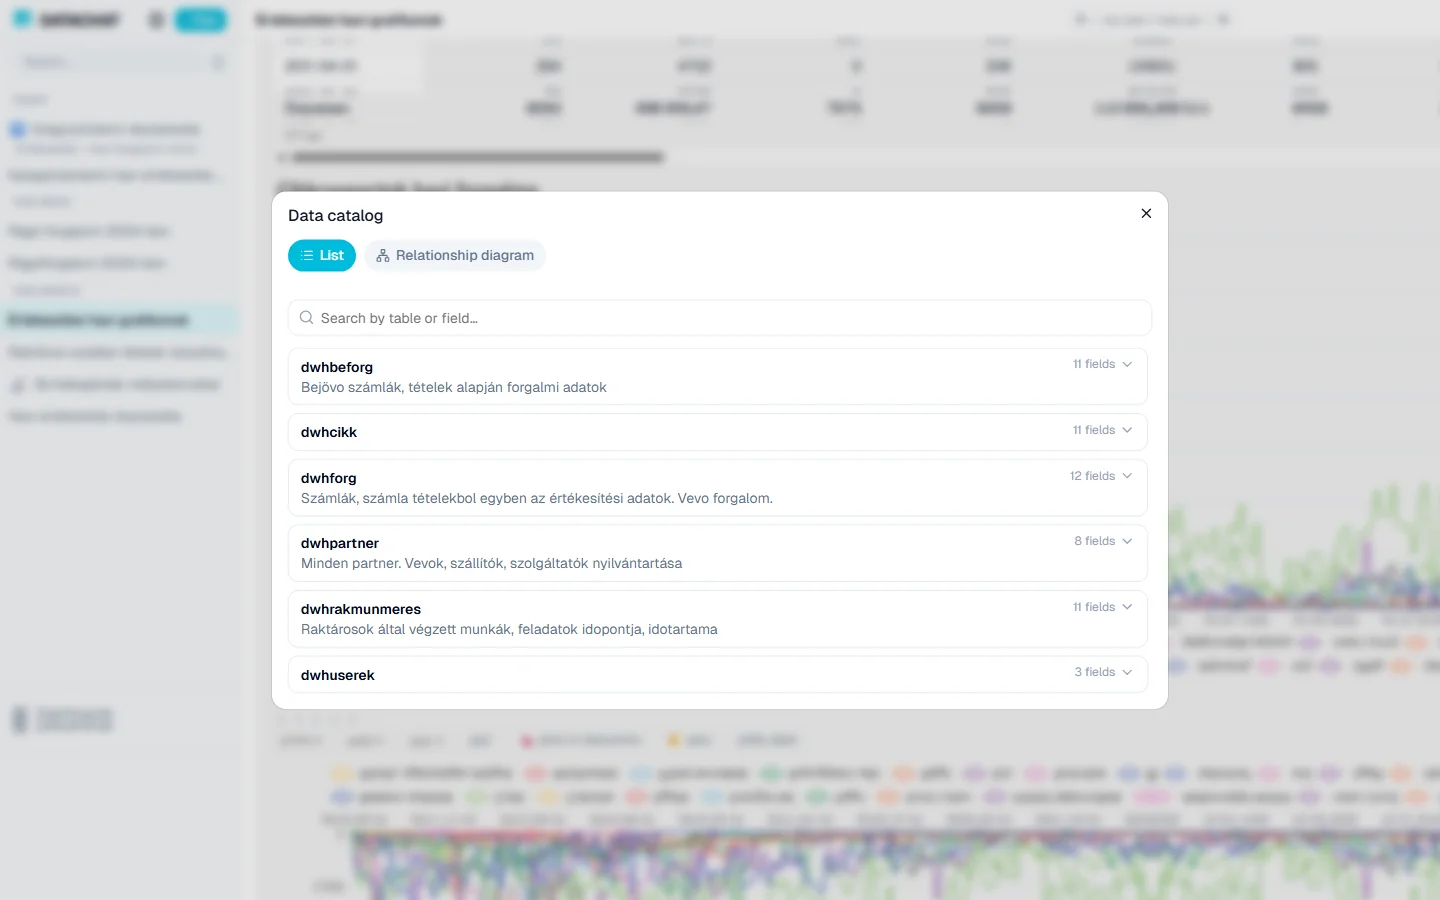
Data catalogue
An in-chat read-only catalogue lists available tables with business names, field descriptions and an interactive relationship graph — so users know exactly what they can query.
Visualization and presentation
25+ chart types
Column, line, pie, radar, heatmap, scatter, sankey, treemap, funnel, gauge, calendar heatmap, 3D column and more ECharts types.
Dumbbell / range chart
Two values per category (p50↔p95, min↔max, plan↔actual) as connected points — to visualize spread.
Explanatory text
Every data answer includes a written interpretation: what the data shows, with which filters, and how to read it.
Smart table
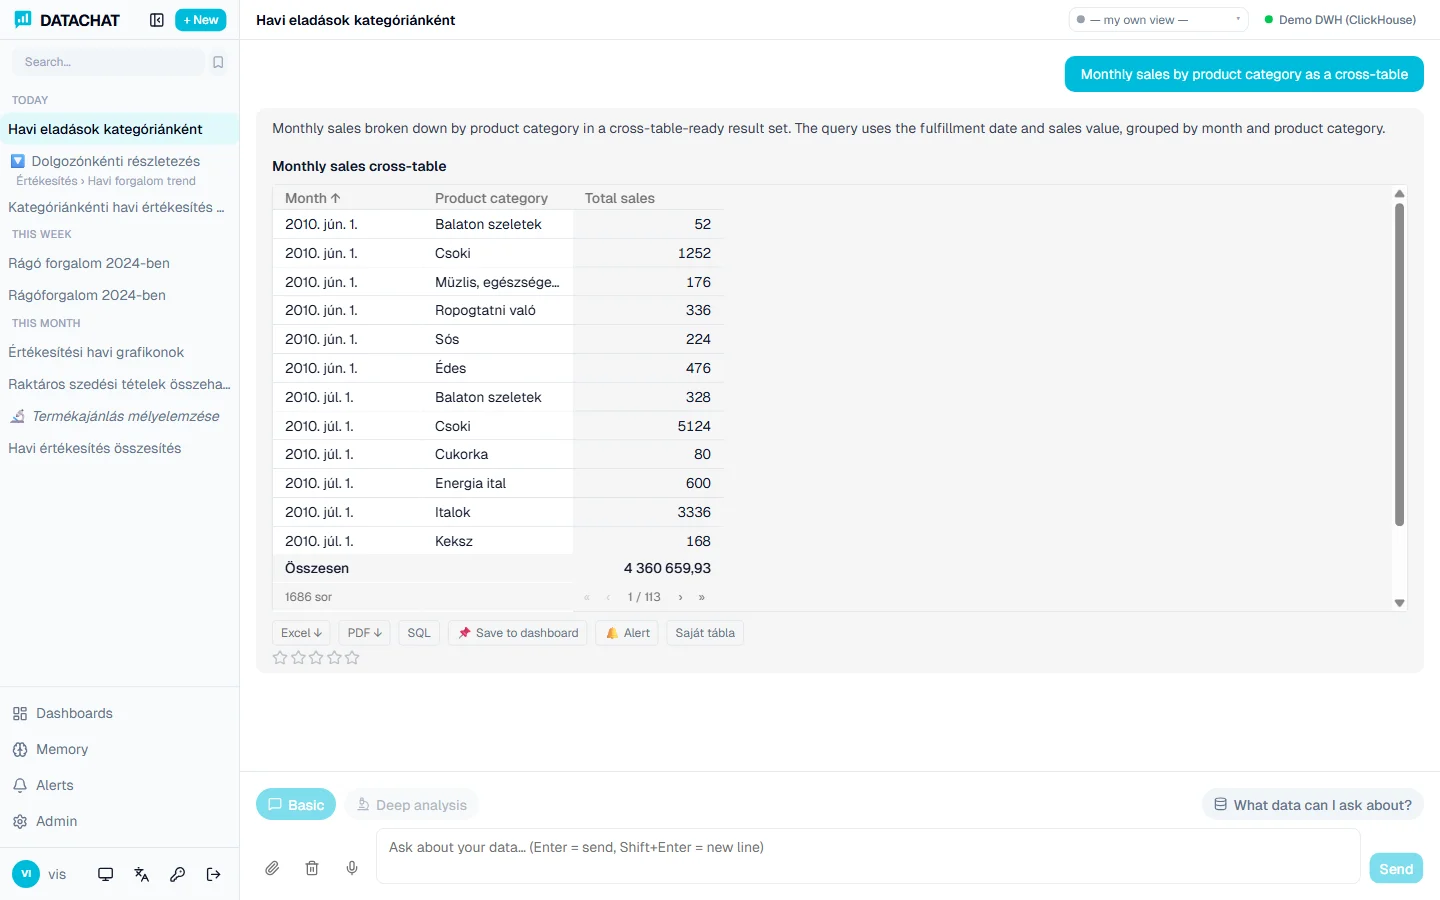
Scrollable, formatted table with automatic column-type detection and decimal preservation. Full view in one click.
Export
Excel (.xlsx) with localized formatting, PNG chart (2x resolution), or PDF with chart and table together.
Responsive & PWA
Renders correctly on mobile, tablet and desktop. Installable to the home screen as a Progressive Web App.
Cross-table (pivot)
Ask for the answer as a pivot table: rows are one dimension, columns another — the column count comes from the data itself. Row, column and grand totals added automatically; multiple row dimensions supported.
Dashboards
Drag & drop layout
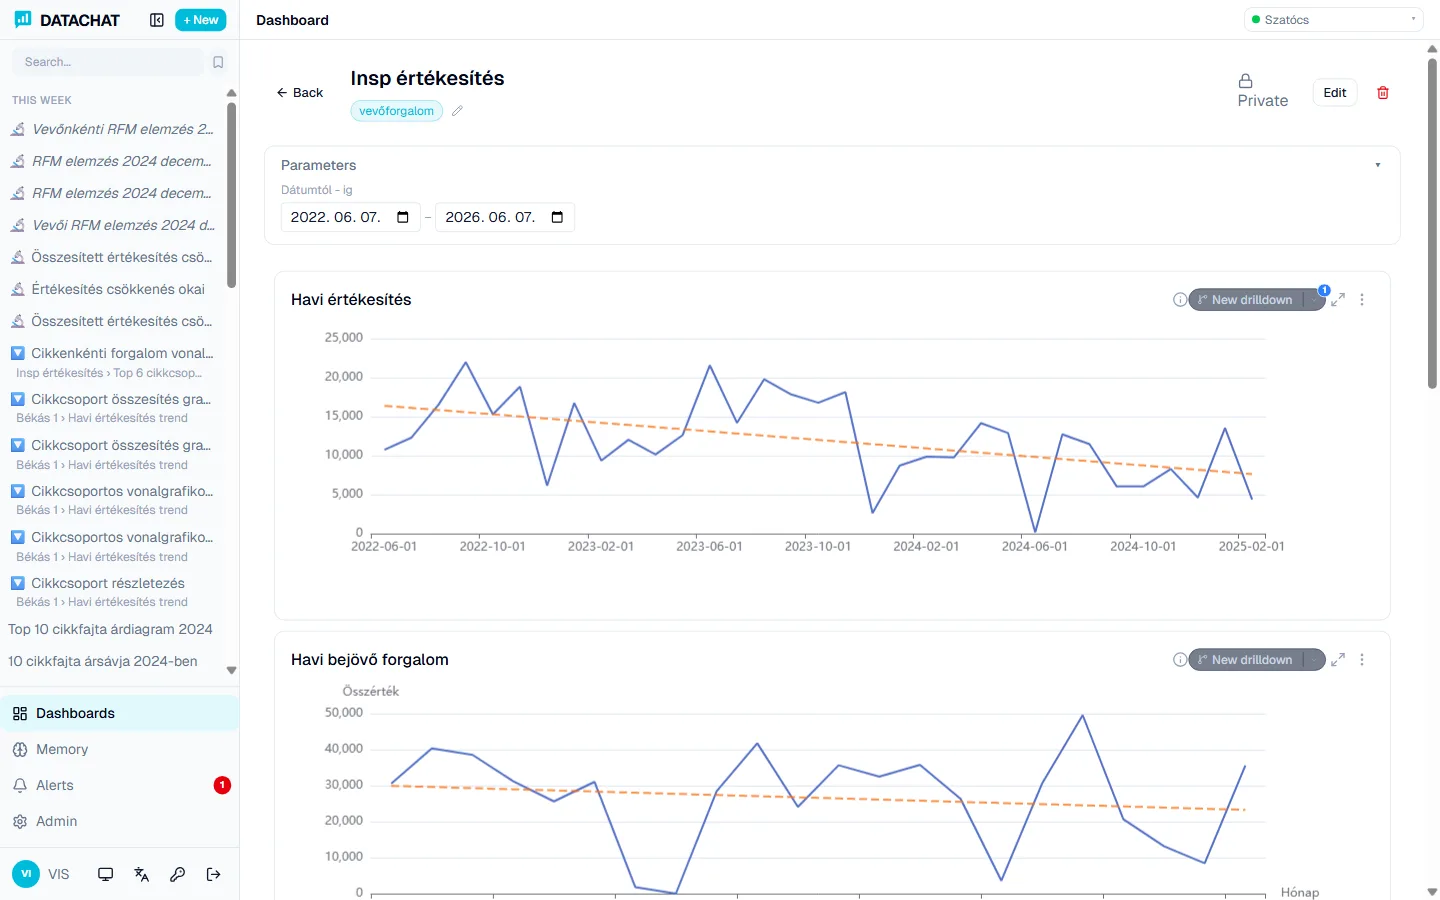
12-column responsive grid — panels move and resize freely with automatic snapping.
KPI gauge and KPI number
A target-achievement gauge with color coding, or a single prominent number with unit, context and conditional coloring.
Dynamic parameters
Date, dropdown, radio, checkbox, number and text filters. Panel SQL aligns to the dashboard filters automatically on save.
Sharing & permissions
Share with roles — each person sees their own data (@usercode filtering). Panels also enforce the user’s table permissions.
Projection mode
Full-screen, no-login display for office screens and boardrooms. Dashboards rotate automatically.
Dashboard assistant
Manage parameters and panel settings in plain language: “bind the date filter into every panel”.
Drill-down, memory and alerts
Drill-down and drill-by
Click a data point to detail the value, or swap dimensions: same X-axis, different breakdown. Multi-level drilling supported.
Ad-hoc deep analysis
Right-click any chart data point → instant deep analysis with no pre-configured drill. The AI starts from the panel’s SQL.
Memory
The system remembers your preferences (“always show my customers for revenue”) and company-level context (VAT rates, fiscal year).
Alerts
Scheduled SQL alerts: if a query returns results, the targeted users or roles get notified — optionally with a chart.
Chat history
Automatic saving and naming, bookmarks, grouping, search and filtering. Any earlier chat can be continued.
Panel copy
Copy a panel with its entire drill chain to another dashboard — the AI adapts the SQL to the target’s parameters.
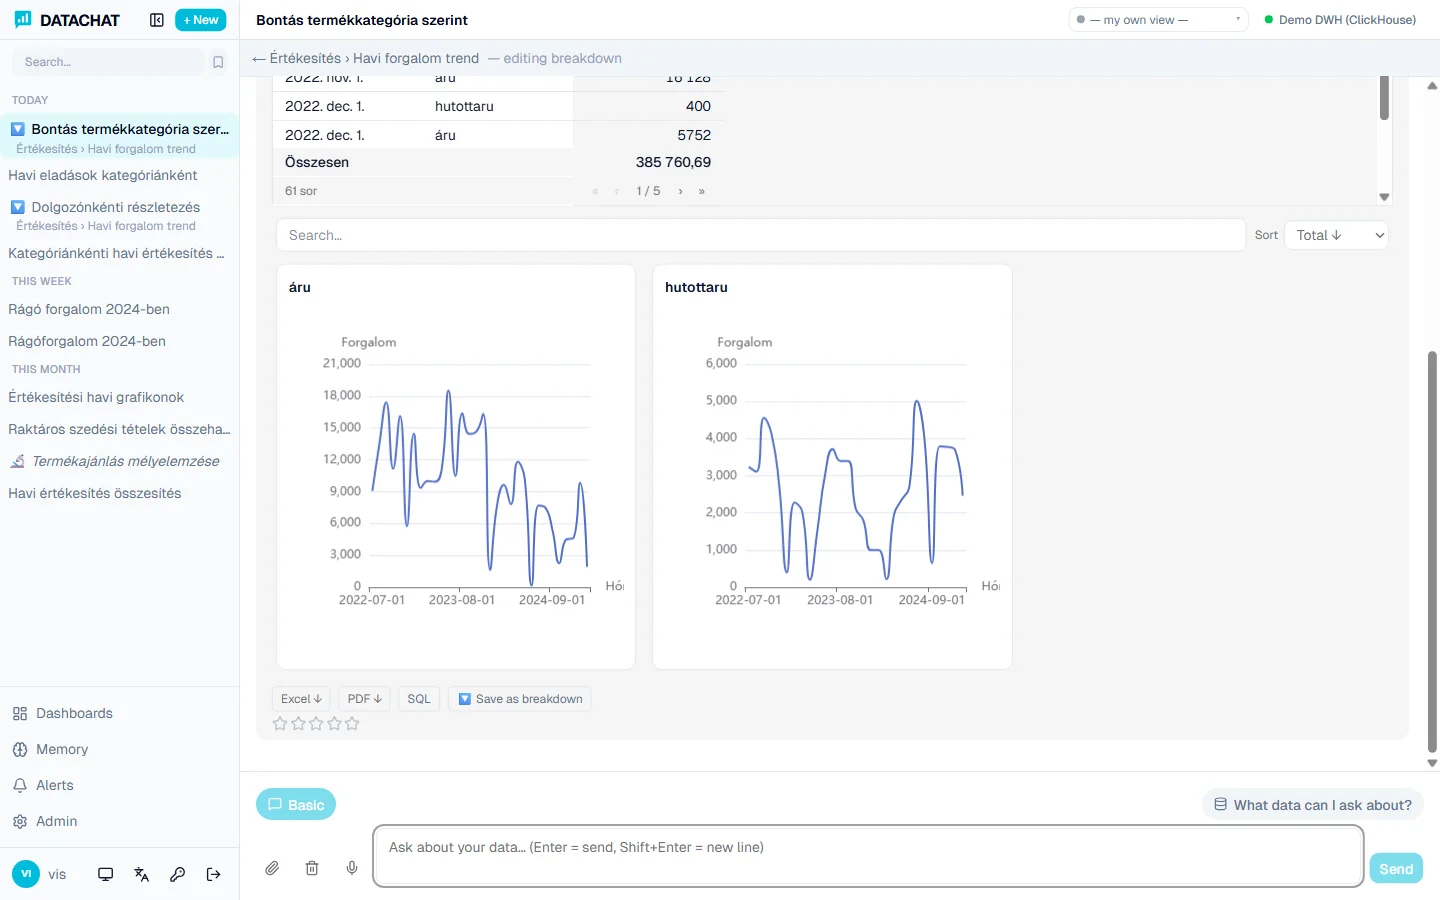
Repeat-by breakdown
Repeats a tile’s full content for every value of a pre-defined sub-dimension in a full-screen scrollable gallery. Unlike drill-down (which filters to one slice), repeat-by projects the entire view across every dimension value simultaneously.
See it work on your own data
We’ll show you a tailored demo built on your Octopus8 data warehouse. 30 minutes, no commitment.